Plots an aggTrees object.
# S3 method for class 'aggTrees'
plot(x, leaves = get_leaves(x$tree), sequence = FALSE, ...)
Arguments
- x
An
aggTreesobject.- leaves
Number of leaves of the desired tree. This can be used to plot subtrees.
- sequence
If
TRUE, the whole sequence of optimal groupings is displayed in a short animation.- ...
Further arguments from
prp.
Value
Plots an aggTrees object.
Details
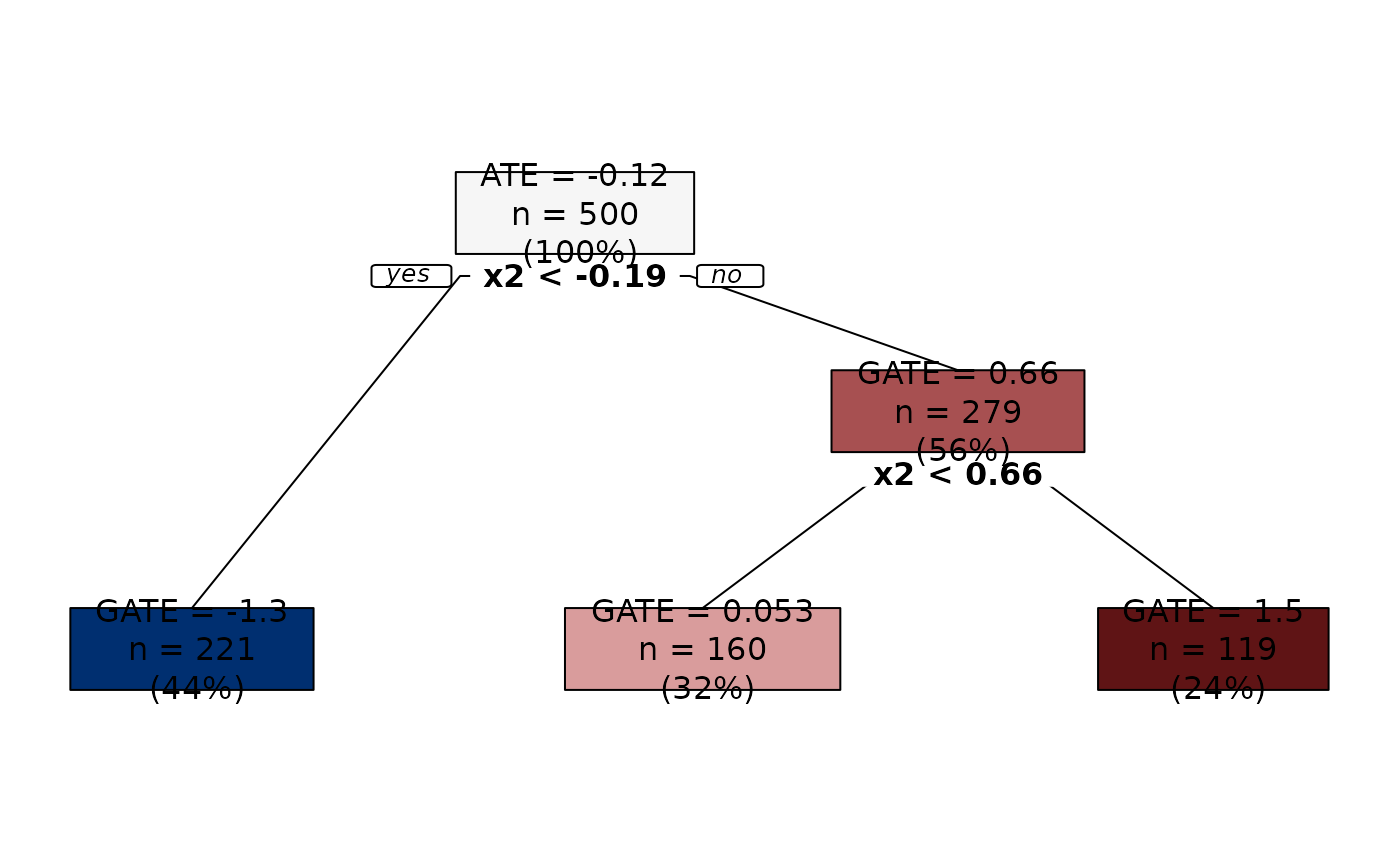
Nodes are colored using a diverging palette. Nodes with predictions smaller than the ATE (i.e., the root prediction) are colored in blue shades, and nodes with predictions larger than the ATE are colored in red shades. Moreover, predictions that are more distant in absolute value from the ATE get darker shades. This way, we have an immediate understanding of the groups with extreme GATEs.
References
Di Francesco, R. (2022). Aggregation Trees. CEIS Research Paper, 546. doi:10.2139/ssrn.4304256 .
See also
Examples
## Generate data.
set.seed(1986)

n <- 1000
k <- 3

X <- matrix(rnorm(n * k), ncol = k)
colnames(X) <- paste0("x", seq_len(k))
D <- rbinom(n, size = 1, prob = 0.5)
mu0 <- 0.5 * X[, 1]
mu1 <- 0.5 * X[, 1] + X[, 2]
Y <- mu0 + D * (mu1 - mu0) + rnorm(n)

## Training-honest sample split.
honest_frac <- 0.5
splits <- sample_split(length(Y), training_frac = (1 - honest_frac))
training_idx <- splits$training_idx
honest_idx <- splits$honest_idx

Y_tr <- Y[training_idx]
D_tr <- D[training_idx]
X_tr <- X[training_idx, ]

Y_hon <- Y[honest_idx]
D_hon <- D[honest_idx]
X_hon <- X[honest_idx, ]

## Construct sequence of groupings. CATEs estimated internally.
groupings <- build_aggtree(Y_tr, D_tr, X_tr,
                           Y_hon, D_hon, X_hon)

## Plot.
plot(groupings)

plot(groupings, leaves = 3)

plot(groupings, sequence = TRUE)


