Plot Method for causalQual Objects
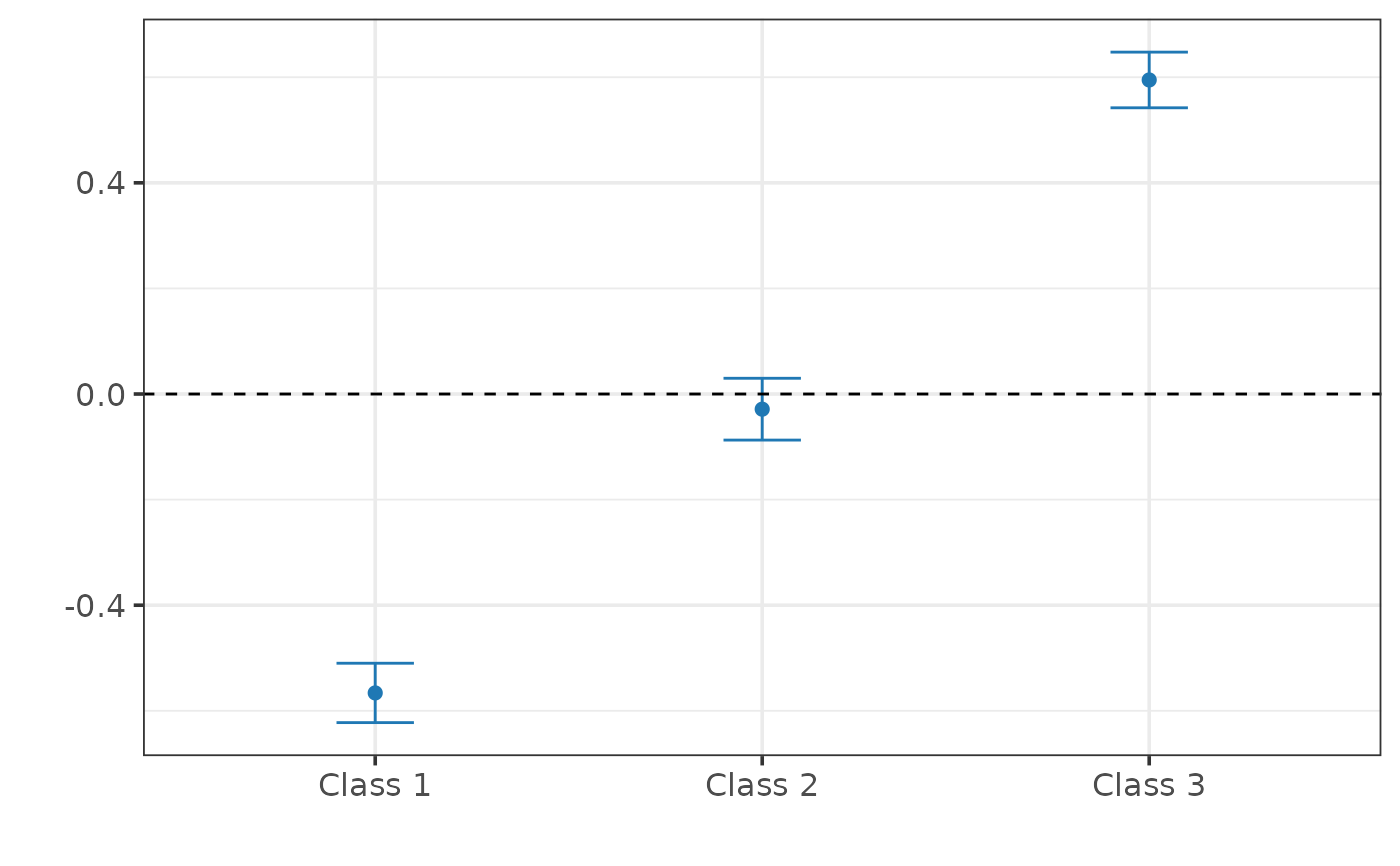
plot.causalQual.RdPlots an causalQual object.
# S3 method for class 'causalQual'
plot(x, hline = TRUE, ...)
Arguments
Value
Plots an causalQual object.
See also
causalQual
Examples
## Generate synthetic data.
set.seed(1986)

data <- generate_qualitative_data_soo(1000, assignment = "observational",
                                      outcome_type = "ordered")
Y <- data$Y
D <- data$D
X <- data$X

## Estimate probabilities of shifts.
fit <- causalQual_soo(Y = Y, D = D, X = X, outcome_type = "ordered")
plot(fit)