Nonparametric estimation of marginal effects using an ocf object.
marginal_effects(
  object,
  data = NULL,
  these_covariates = NULL,
  eval = "atmean",
  bandwitdh = 0.1,
  inference = FALSE
)
Arguments
- object
An
ocfobject.- data
Data set of class
data.frameto estimate marginal effects. It must contain at least the same covariates used to train the forests. IfNULL, marginal effects are estimated onobject$full_data.- these_covariates
Named list with covariates' names as keys and strings denoting covariates' types as entries. Strings must be either
"continuous"or"discrete". The names of the list indicate the covariates for which marginal effect estimation is desired. IfNULL(the default), marginal effects are estimated for all covariates and covariates' types are inferred by the routine.- eval
Evaluation point for marginal effects. Either
"mean","atmean"or"atmedian".- bandwitdh
How many standard deviations
x_upandx_downdiffer fromx.- inference
Whether to extract weights and compute standard errors. The weights extraction considerably slows down the program.
Value
Object of class ocf.marginal.
Details
marginal_effects can estimate mean marginal effects, marginal effects at the mean, or marginal effects at the
median, according to the eval argument.
If these_covariates is NULL (the default), the routine assumes that covariates with with at most ten unique values are categorical and treats the remaining covariates as continuous.
References
Di Francesco, R. (2025). Ordered Correlation Forest. Econometric Reviews, 1–17. doi:10.1080/07474938.2024.2429596 .
See also
Examples
## Generate synthetic data.
set.seed(1986)

data <- generate_ordered_data(100)
sample <- data$sample
Y <- sample$Y
X <- sample[, -1]

## Fit ocf.
forests <- ocf(Y, X)

## Marginal effects at the mean.
me <- marginal_effects(forests, eval = "atmean")

print(me)
#> ocf marginal effects results
#>
#> Data info:
#> Number of classes:    3
#> Sample size:          100
#>
#> Tuning parameters:
#> Evaluation:           atmean
#> Bandwidth:            0.1
#> Number of trees:      2000
#> Honest forests:       FALSE
#> Honesty fraction:     0
#>
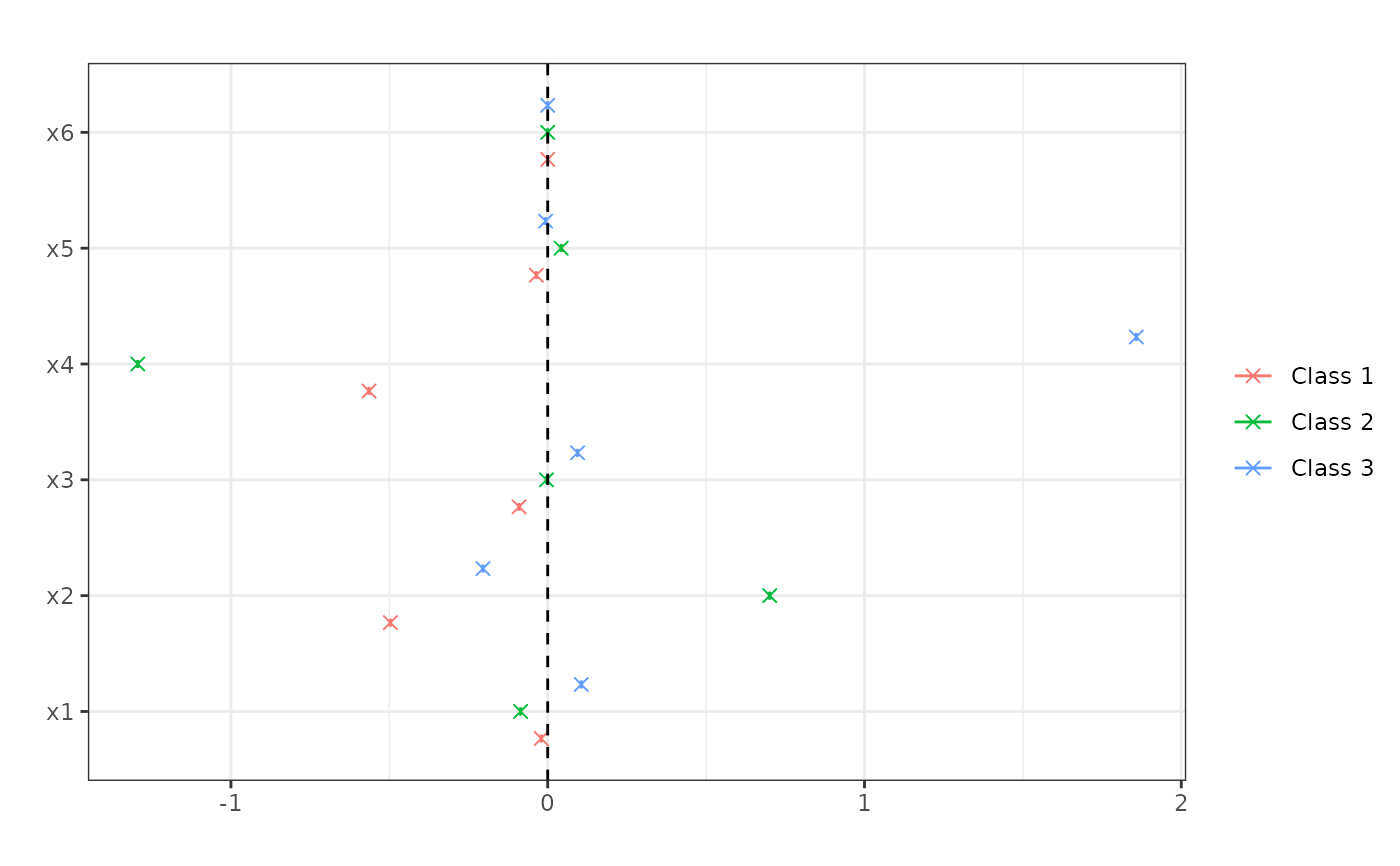
#> Marginal Effects:
#>    P'(Y=1) P'(Y=2) P'(Y=3)
#> x1  -0.020  -0.086   0.106
#> x2  -0.497   0.701  -0.204
#> x3  -0.090  -0.004   0.094
#> x4  -0.564  -1.294   1.858
#> x5  -0.036   0.043  -0.007
#> x6   0.000   0.000   0.000
print(me, latex = TRUE)
#> \begingroup
#>     \setlength{\tabcolsep}{8pt}
#>     \renewcommand{\arraystretch}{1.1}
#>     \begin{table}[H]
#>         \centering
#>         \begin{adjustbox}{width = 0.75\textwidth}
#>         \begin{tabular}{@{\extracolsep{5pt}}l c c c}
#>         \\[-1.8ex]\hline
#>         \hline \\[-1.8ex]
#>         & Class 1 & Class 2 & Class 3 \\
#>         \addlinespace[2pt]
#>         \hline \\[-1.8ex]
#>
#>         \texttt{x1} & -0.02 & -0.086 & 0.106 \\
#>         \texttt{x2} & -0.497 & 0.701 & -0.204 \\
#>         \texttt{x3} & -0.09 & -0.004 & 0.094 \\
#>         \texttt{x4} & -0.564 & -1.294 & 1.858 \\
#>         \texttt{x5} & -0.036 & 0.043 & -0.007 \\
#>         \texttt{x6} & 0 & 0 & 0 \\
#>
#>         \addlinespace[3pt]
#>         \\[-1.8ex]\hline
#>         \hline \\[-1.8ex]
#>         \end{tabular}
#>         \end{adjustbox}
#>         \caption{Marginal effects.}
#>         \label{table:ocf.marginal.effects}
#>     \end{table}
#> \endgroup
plot(me)


## Compute standard errors. This requires honest forests.
honest_forests <- ocf(Y, X, honesty = TRUE)
honest_me <- marginal_effects(honest_forests, eval = "atmean", inference = TRUE)

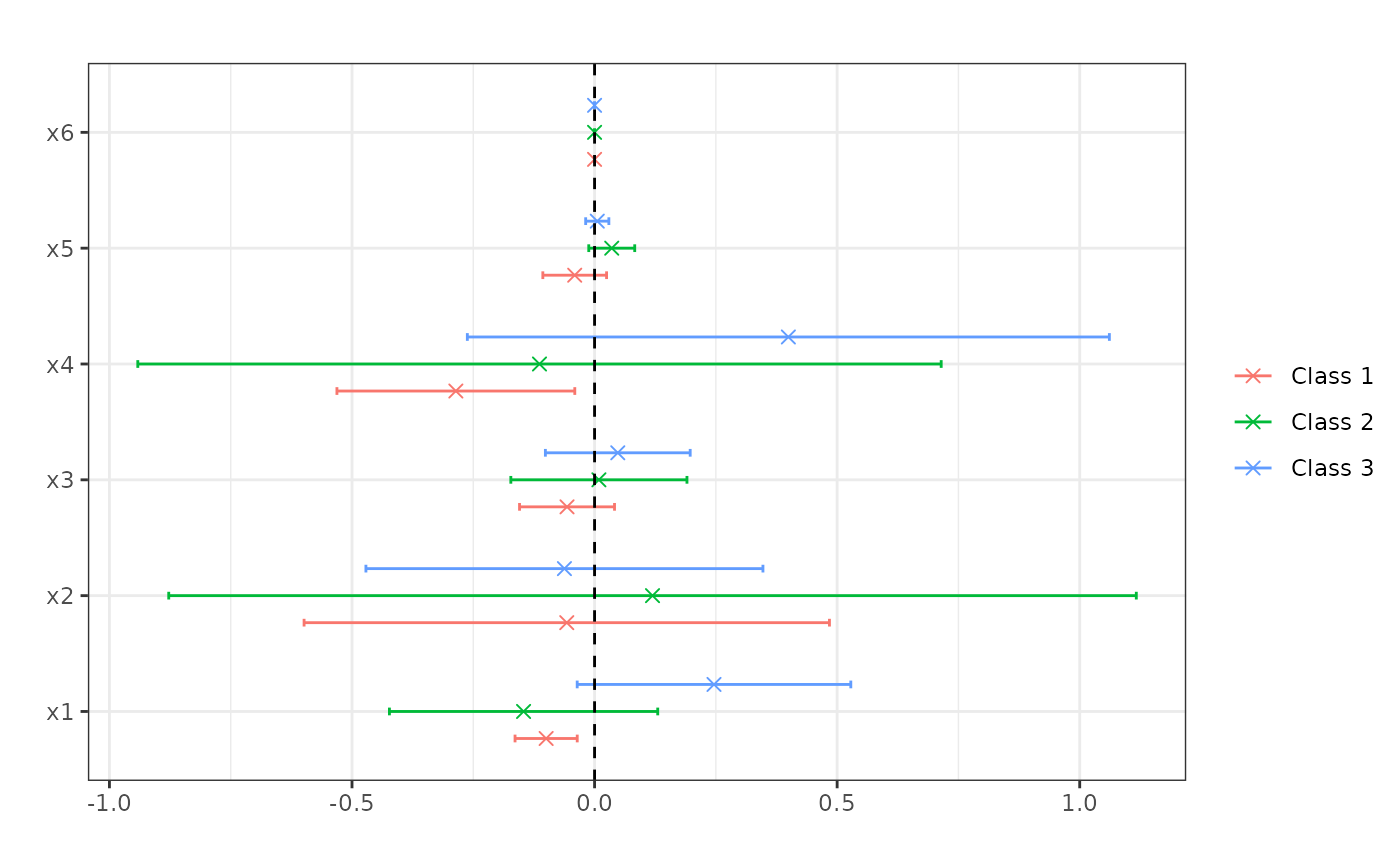
print(honest_me, latex = TRUE)
#> \begingroup
#>     \setlength{\tabcolsep}{8pt}
#>     \renewcommand{\arraystretch}{1.1}
#>     \begin{table}[H]
#>         \centering
#>         \begin{adjustbox}{width = 0.75\textwidth}
#>         \begin{tabular}{@{\extracolsep{5pt}}l c c c}
#>         \\[-1.8ex]\hline
#>         \hline \\[-1.8ex]
#>         & Class 1 & Class 2 & Class 3 \\
#>         \addlinespace[2pt]
#>         \hline \\[-1.8ex]
#>
#>         \texttt{x1} & -0.1 & -0.146 & 0.246 \\
#>                      & (0.033) & (0.141) & (0.144) \\
#>         \texttt{x2} & -0.057 & 0.119 & -0.062 \\
#>                      & (0.276) & (0.509) & (0.209) \\
#>         \texttt{x3} & -0.057 & 0.009 & 0.048 \\
#>                      & (0.05) & (0.093) & (0.076) \\
#>         \texttt{x4} & -0.286 & -0.114 & 0.399 \\
#>                      & (0.125) & (0.422) & (0.338) \\
#>         \texttt{x5} & -0.041 & 0.035 & 0.006 \\
#>                      & (0.034) & (0.024) & (0.012) \\
#>         \texttt{x6} & 0 & 0 & 0 \\
#>                      & (0) & (0) & (0) \\
#>
#>         \addlinespace[3pt]
#>         \\[-1.8ex]\hline
#>         \hline \\[-1.8ex]
#>         \end{tabular}
#>         \end{adjustbox}
#>         \caption{Marginal effects.}
#>         \label{table:ocf.marginal.effects}
#>     \end{table}
#> \endgroup
plot(honest_me)


## Subset covariates and select covariates' types.
my_covariates <- list("x1" = "continuous", "x2" = "discrete", "x4" = "discrete")
honest_me <- marginal_effects(honest_forests, eval = "atmean", inference = TRUE,
                              these_covariates = my_covariates)
print(honest_me)
#> ocf marginal effects results
#>
#> Data info:
#> Number of classes:    3
#> Sample size:          100
#>
#> Tuning parameters:
#> Evaluation:           atmean
#> Bandwidth:            0.1
#> Number of trees:      2000
#> Honest forests:       TRUE
#> Honesty fraction:     0.5
#>
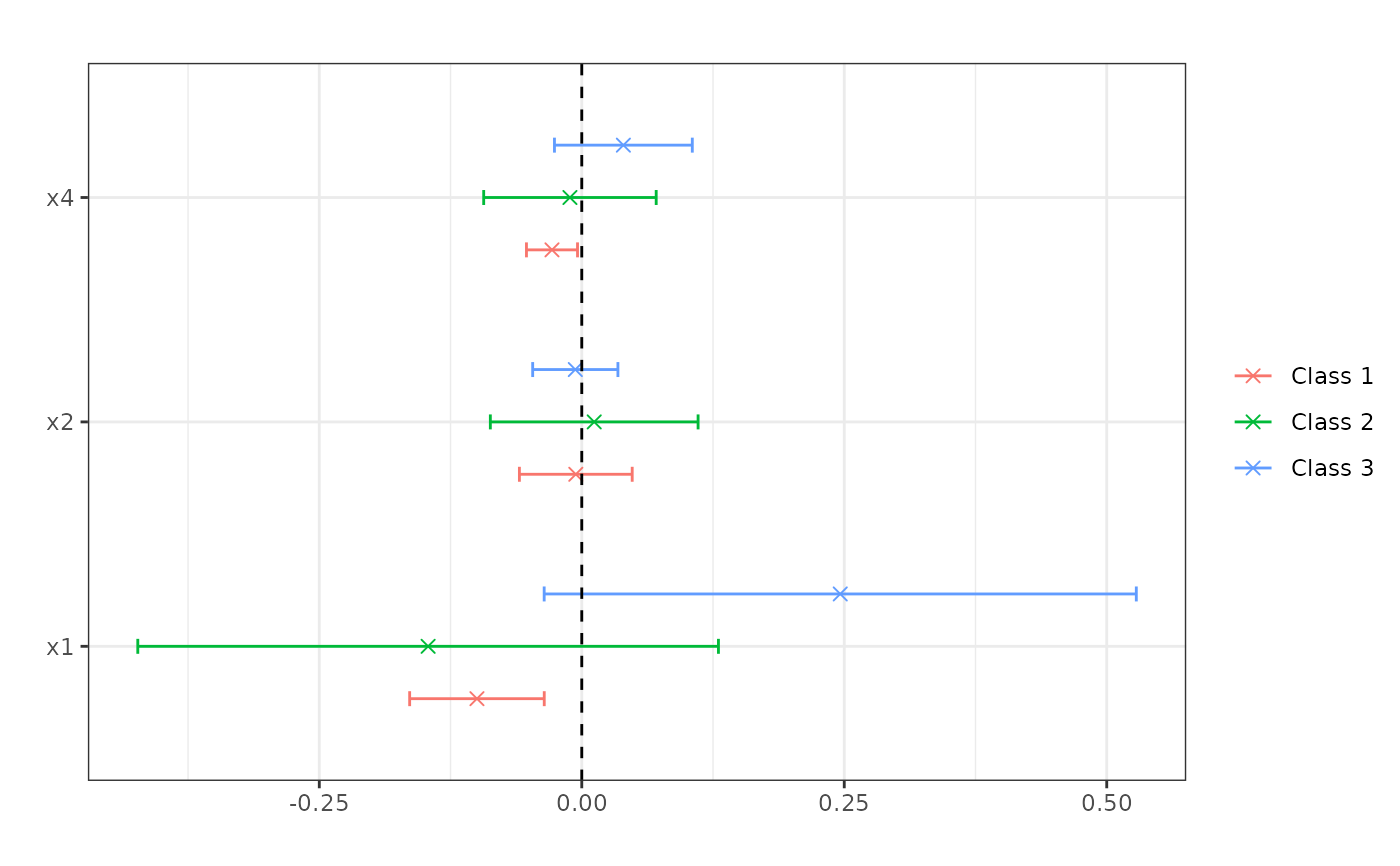
#> Marginal Effects:
#>    P'(Y=1) P'(Y=2) P'(Y=3)
#> x1  -0.100  -0.146   0.246
#> x2  -0.006   0.012  -0.006
#> x4  -0.028  -0.011   0.040
plot(honest_me)
