Nonparametric estimator for ordered non-numeric outcomes. The estimator modifies a standard random forest splitting criterion to build a collection of forests, each estimating the conditional probability of a single class.
Arguments
- Y
Outcome vector.
- X
Covariate matrix (no intercept).
- honesty
Whether to grow honest forests.
- honesty.fraction
Fraction of honest sample. Ignored if
honesty = FALSE.- inference
Whether to extract weights and compute standard errors. The weights extraction considerably slows down the routine.
honesty = TRUEis required for valid inference.- alpha
Controls the balance of each split. Each split leaves at least a fraction
alphaof observations in the parent node on each side of the split.- n.trees
Number of trees.
- mtry
Number of covariates to possibly split at in each node. Default is the square root of the number of covariates.
- min.node.size
Minimal node size.
- max.depth
Maximal tree depth. A value of 0 corresponds to unlimited depth, 1 to "stumps" (one split per tree).
- replace
If
TRUE, grow trees on bootstrap subsamples. Otherwise, trees are grown on random subsamples drawn without replacement.- sample.fraction
Fraction of observations to sample.
- n.threads
Number of threads. Zero corresponds to the number of CPUs available.
Value
Object of class ocf.
References
Di Francesco, R. (2025). Ordered Correlation Forest. Econometric Reviews, 1–17. doi:10.1080/07474938.2024.2429596 .
See also
Examples
## Generate synthetic data.
set.seed(1986)

data <- generate_ordered_data(100)
sample <- data$sample
Y <- sample$Y
X <- sample[, -1]

## Training-test split.
train_idx <- sample(seq_len(length(Y)), floor(length(Y) * 0.5))

Y_tr <- Y[train_idx]
X_tr <- X[train_idx, ]

Y_test <- Y[-train_idx]
X_test <- X[-train_idx, ]

## Fit ocf on training sample.
forests <- ocf(Y_tr, X_tr)

## We have compatibility with generic S3-methods.
print(forests)
#> Call:
#> ocf(Y_tr, X_tr)
#>
#> Data info:
#> Full sample size:   50
#> N. covariates:      6
#> Classes:            1 2 3
#>
#> Relative variable importance:
#>    x1    x2    x3    x4    x5    x6
#> 0.369 0.075 0.253 0.101 0.172 0.030
#>
#> Tuning parameters:
#> N. trees:           2000
#> mtry:               3
#> min.node.size       5
#> Subsampling scheme: No replacement
#> Honesty:            FALSE
#> Honest fraction:    0
summary(forests)
#> Call:
#> ocf(Y_tr, X_tr)
#>
#> Data info:
#> Full sample size:   50
#> N. covariates:      6
#> Classes:            1 2 3
#>
#> Relative variable importance:
#>    x1    x2    x3    x4    x5    x6
#> 0.369 0.075 0.253 0.101 0.172 0.030
#>
#> Tuning parameters:
#> N. trees:           2000
#> mtry:               3
#> min.node.size       5
#> Subsampling scheme: No replacement
#> Honesty:            FALSE
#> Honest fraction:    0
predictions <- predict(forests, X_test)
head(predictions$probabilities)
#>         P(Y=1)    P(Y=2)     P(Y=3)
#> [1,] 0.3543743 0.5375517 0.10807401
#> [2,] 0.4571570 0.4057421 0.13710091
#> [3,] 0.1173914 0.4803692 0.40223943
#> [4,] 0.6342519 0.3132168 0.05253126
#> [5,] 0.3482501 0.3873043 0.26444560
#> [6,] 0.6284292 0.2999011 0.07166965
table(Y_test, predictions$classification)
#>
#> Y_test  1  2  3
#>      1 12  3  1
#>      2  6  6  7
#>      3  3  2 10

## Compute standard errors. This requires honest forests.
honest_forests <- ocf(Y_tr, X_tr, honesty = TRUE, inference = TRUE)
head(honest_forests$predictions$standard.errors)
#>          P(Y=1)     P(Y=2)     P(Y=3)
#> [1,] 0.14707811 0.10843407 0.12503924
#> [2,] 0.25424513 0.12183948 0.08781877
#> [3,] 0.09562321 0.08456940 0.17198078
#> [4,] 0.08479858 0.10601795 0.17985686
#> [5,] 0.07368632 0.07498043 0.17513137
#> [6,] 0.08458887 0.11259881 0.13967386

## Marginal effects.
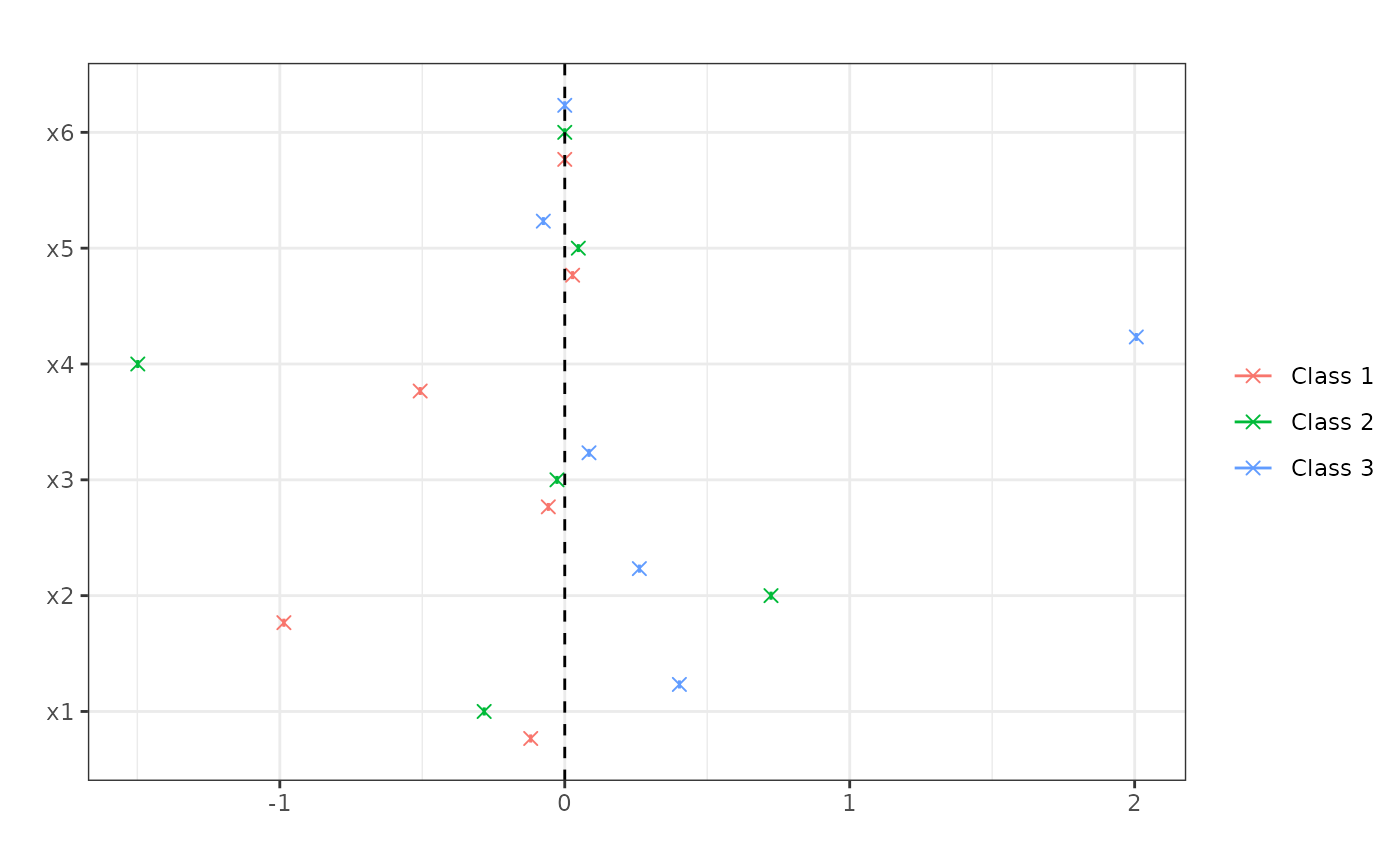
me <- marginal_effects(forests, eval = "atmean")
print(me)
#> ocf marginal effects results
#>
#> Data info:
#> Number of classes:    3
#> Sample size:          50
#>
#> Tuning parameters:
#> Evaluation:           atmean
#> Bandwidth:            0.1
#> Number of trees:      2000
#> Honest forests:       FALSE
#> Honesty fraction:     0
#>
#> Marginal Effects:
#>    P'(Y=1) P'(Y=2) P'(Y=3)
#> x1  -0.119  -0.283   0.402
#> x2  -0.986   0.724   0.262
#> x3  -0.058  -0.027   0.085
#> x4  -0.507  -1.498   2.006
#> x5   0.028   0.048  -0.075
#> x6   0.000   0.000   0.000
print(me, latex = TRUE)
#> \begingroup
#>     \setlength{\tabcolsep}{8pt}
#>     \renewcommand{\arraystretch}{1.1}
#>     \begin{table}[H]
#>         \centering
#>         \begin{adjustbox}{width = 0.75\textwidth}
#>         \begin{tabular}{@{\extracolsep{5pt}}l c c c}
#>         \\[-1.8ex]\hline
#>         \hline \\[-1.8ex]
#>         & Class 1 & Class 2 & Class 3 \\
#>         \addlinespace[2pt]
#>         \hline \\[-1.8ex]
#>
#>         \texttt{x1} & -0.119 & -0.283 & 0.402 \\
#>         \texttt{x2} & -0.986 & 0.724 & 0.262 \\
#>         \texttt{x3} & -0.058 & -0.027 & 0.085 \\
#>         \texttt{x4} & -0.507 & -1.498 & 2.006 \\
#>         \texttt{x5} & 0.028 & 0.048 & -0.075 \\
#>         \texttt{x6} & 0 & 0 & 0 \\
#>
#>         \addlinespace[3pt]
#>         \\[-1.8ex]\hline
#>         \hline \\[-1.8ex]
#>         \end{tabular}
#>         \end{adjustbox}
#>         \caption{Marginal effects.}
#>         \label{table:ocf.marginal.effects}
#>     \end{table}
#> \endgroup
plot(me)


## Compute standard errors. This requires honest forests.
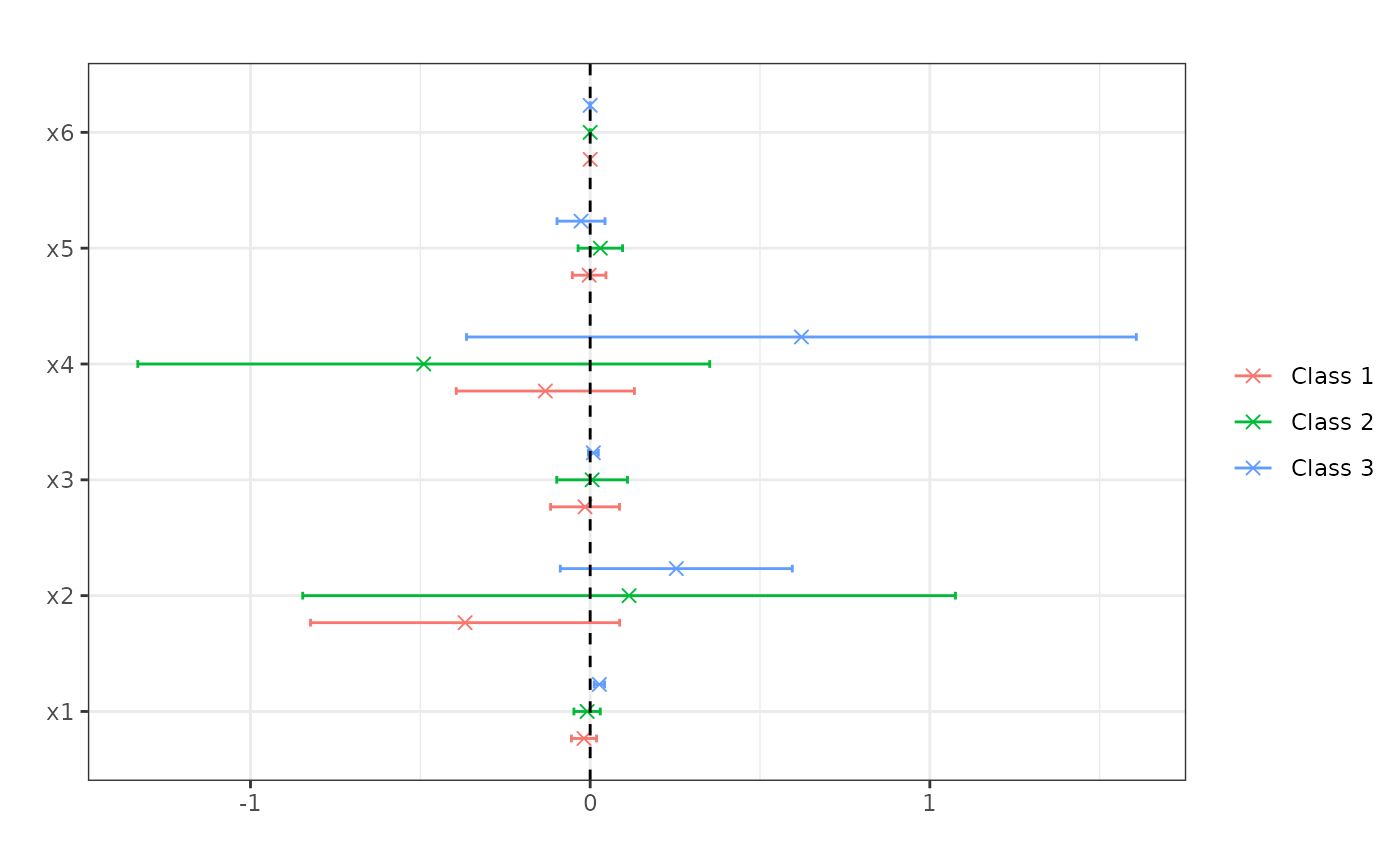
honest_me <- marginal_effects(honest_forests, eval = "atmean", inference = TRUE)
print(honest_me, latex = TRUE)
#> \begingroup
#>     \setlength{\tabcolsep}{8pt}
#>     \renewcommand{\arraystretch}{1.1}
#>     \begin{table}[H]
#>         \centering
#>         \begin{adjustbox}{width = 0.75\textwidth}
#>         \begin{tabular}{@{\extracolsep{5pt}}l c c c}
#>         \\[-1.8ex]\hline
#>         \hline \\[-1.8ex]
#>         & Class 1 & Class 2 & Class 3 \\
#>         \addlinespace[2pt]
#>         \hline \\[-1.8ex]
#>
#>         \texttt{x1} & -0.018 & -0.009 & 0.027 \\
#>                      & (0.019) & (0.02) & (0.008) \\
#>         \texttt{x2} & -0.368 & 0.115 & 0.254 \\
#>                      & (0.232) & (0.49) & (0.174) \\
#>         \texttt{x3} & -0.015 & 0.006 & 0.009 \\
#>                      & (0.052) & (0.053) & (0.008) \\
#>         \texttt{x4} & -0.132 & -0.49 & 0.622 \\
#>                      & (0.134) & (0.43) & (0.503) \\
#>         \texttt{x5} & -0.003 & 0.03 & -0.027 \\
#>                      & (0.025) & (0.033) & (0.036) \\
#>         \texttt{x6} & 0 & 0 & 0 \\
#>                      & (0) & (0) & (0) \\
#>
#>         \addlinespace[3pt]
#>         \\[-1.8ex]\hline
#>         \hline \\[-1.8ex]
#>         \end{tabular}
#>         \end{adjustbox}
#>         \caption{Marginal effects.}
#>         \label{table:ocf.marginal.effects}
#>     \end{table}
#> \endgroup
plot(honest_me)
