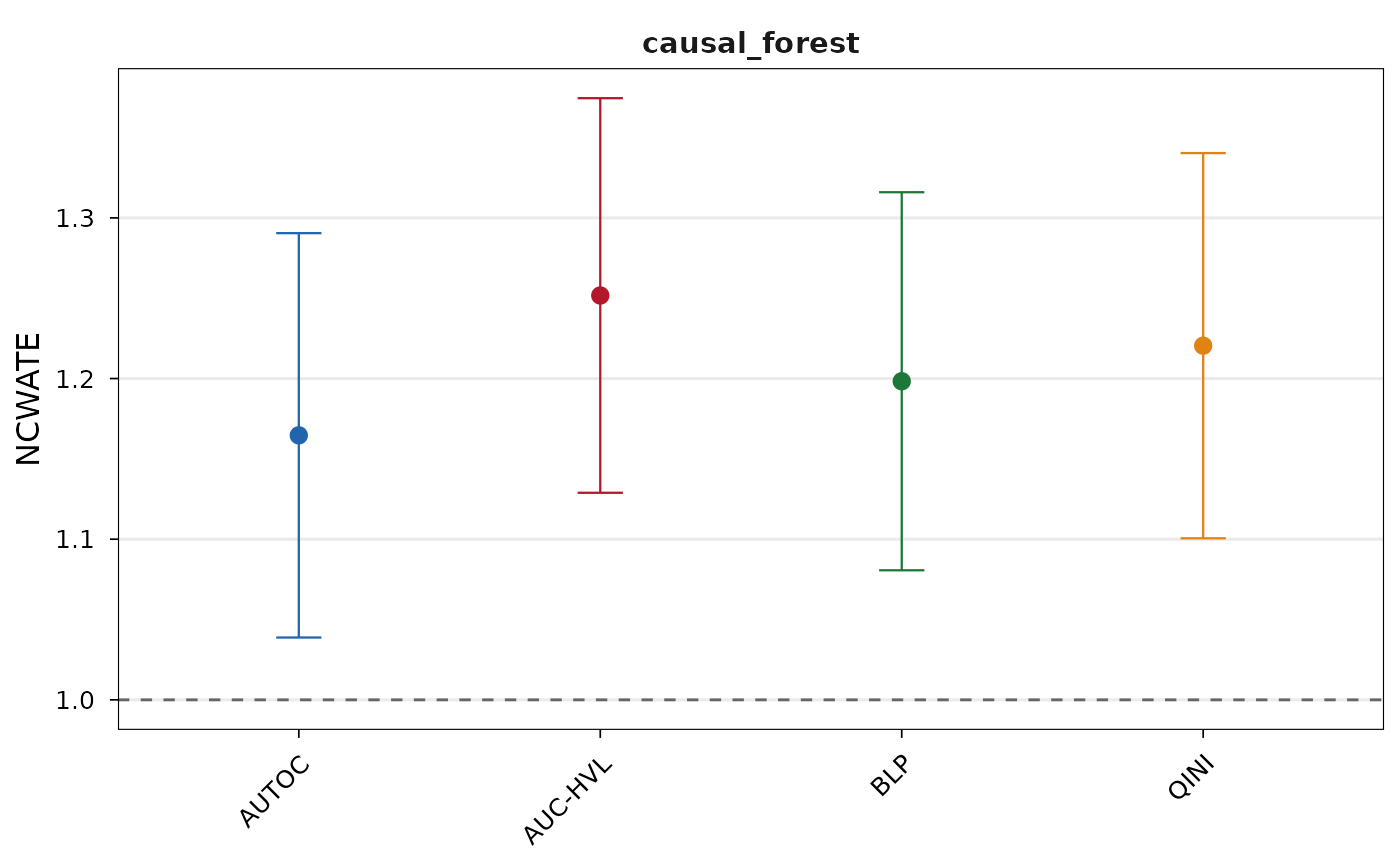
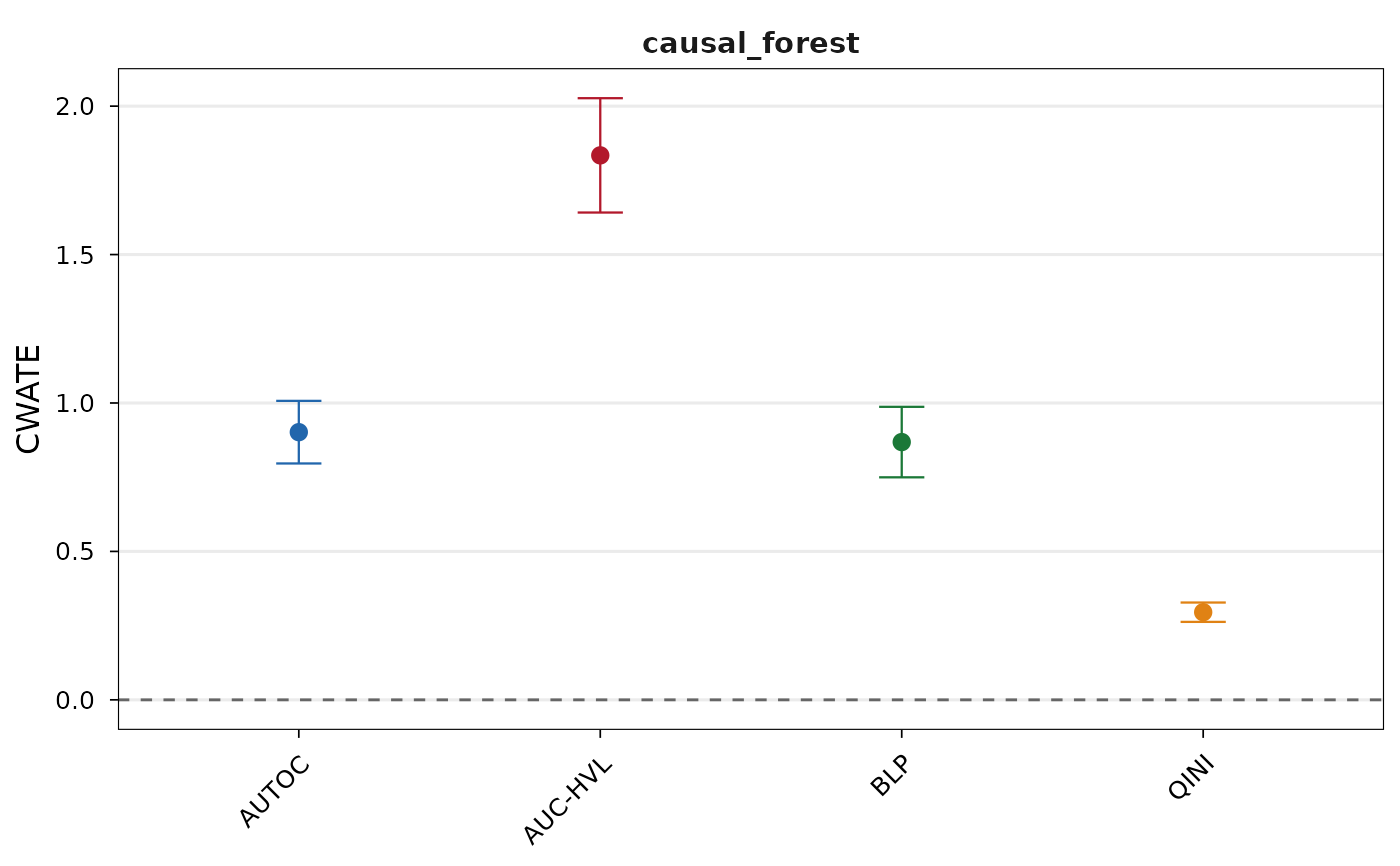
Produces a coefficient plot of CWATE or NCWATE estimates with confidence intervals.
# S3 method for class 'valiCATE'
plot(x, type = "cwate", ...)
Arguments
- x
An
valiCATEobject.- type
Character, either
"cwate"or"ncwate". Controls which estimand is plotted.- ...
Further arguments passed to or from other methods.
Value
A ggplot object, returned invisibly.
Details
This method requires the ggplot2 package. The plot displays point estimates as dots and
confidence intervals as vertical whiskers, faceted by model. A horizontal reference line is drawn
at 0 for the CWATE (null: no heterogeneity) and at 1 for the NCWATE (null: recovery).
References
Di Francesco, R., & Knaus, M. C. (2025). Validating ML Predictions of Heterogeneous Treatment Effects via CWATE.
See also
Examples
## Generate data.
set.seed(1986)

n <- 1000
k <- 2

X <- matrix(rnorm(n * k), ncol = k)
colnames(X) <- paste0("x", seq_len(k))
D <- rbinom(n, size = 1, prob = 0.5)
mu0 <- 0.5 * X[, 1]
mu1 <- 0.5 * X[, 1] + X[, 2]
Y <- mu0 + D * (mu1 - mu0) + rnorm(n, sd = 0.5)

## Split into training and validation samples.
train_idx <- sample(1:n, n / 2)
val_idx <- setdiff(1:n, train_idx)

## Estimate CATEs on the training sample, predict on the validation sample.
library(grf)
cf <- causal_forest(X[train_idx, ], Y[train_idx], D[train_idx])
cates <- predict(cf, X[val_idx, ])$predictions

## Validate using the validation sample.
result <- valiCATE(Y[val_idx], D[val_idx], X[val_idx, ],
                   cates = list("causal_forest" = cates))
#> Estimating nuisance functions via 5 -fold cross-fitting;
#> CWATE/NCWATE estimation for model: causal_forest ;
#> Output.
#>

## Plot.
plot(result)

plot(result, type = "ncwate")