Plots an ocf.marginal object.
# S3 method for class 'ocf.marginal'
plot(
  x,
  class_names = NULL,
  point_size = 2,
  facet_text_size = 12,
  legend_text_size = 10,
  ...
)
Arguments
- x
An
ocf.marginalobject.- class_names
Character vector of length equal to
x$n.classesto set class names in the plot.- point_size
Controls the points' size.
- facet_text_size
Controls the facets' labels' size.
- legend_text_size
Controls the legends' size.
- ...
Further arguments passed to or from other methods.
Value
Plots an ocf.marginal object.
Details
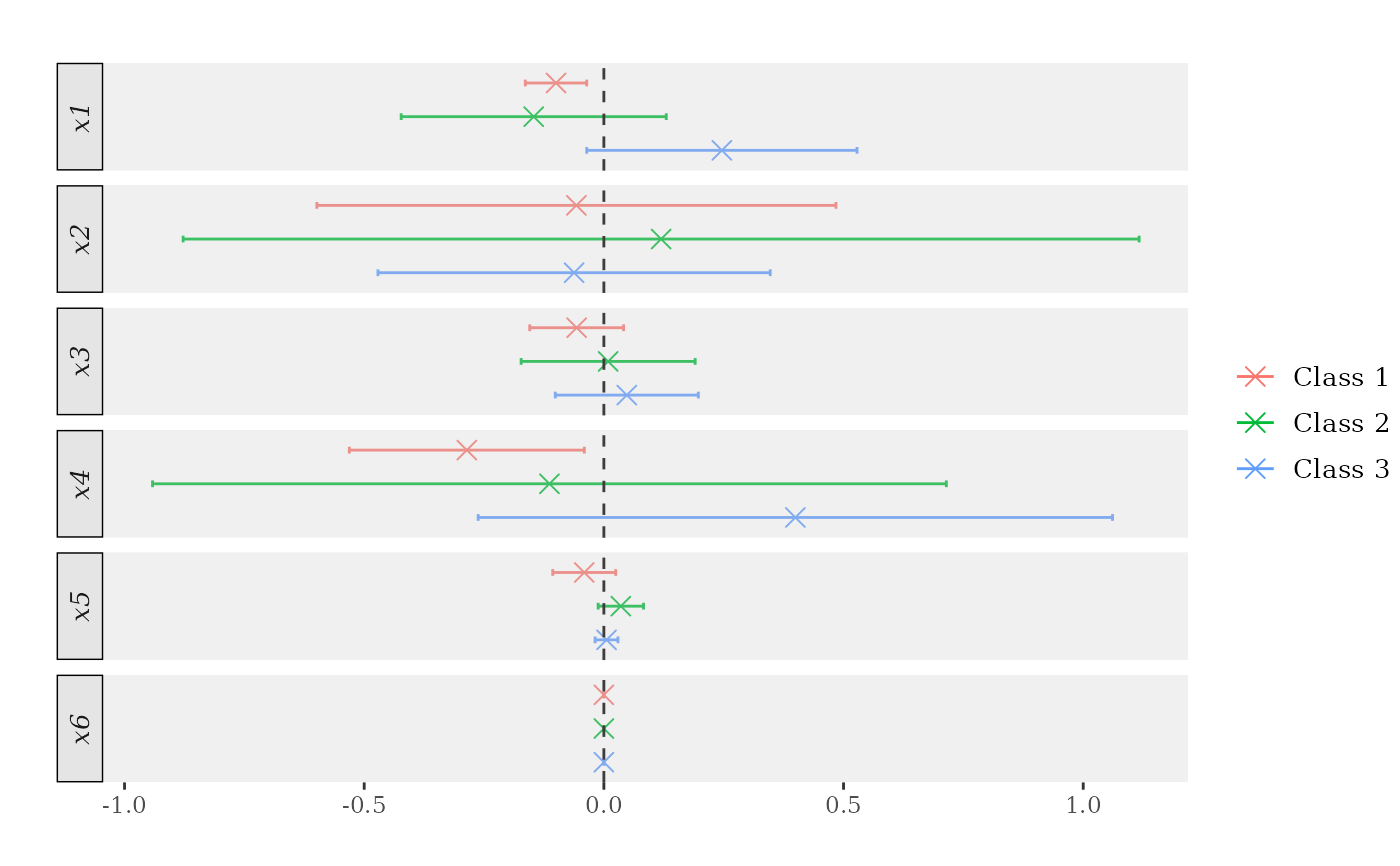
If standard errors have been estimated, 95% confidence intervals are shown.
References
Di Francesco, R. (2025). Ordered Correlation Forest. Econometric Reviews, 1–17. doi:10.1080/07474938.2024.2429596 .
See also
Examples
## Generate synthetic data.
set.seed(1986)
data <- generate_ordered_data(100)
sample <- data$sample
Y <- sample$Y
X <- sample[, -1]
## Fit ocf.
forests <- ocf(Y, X)
## Marginal effects at the mean.
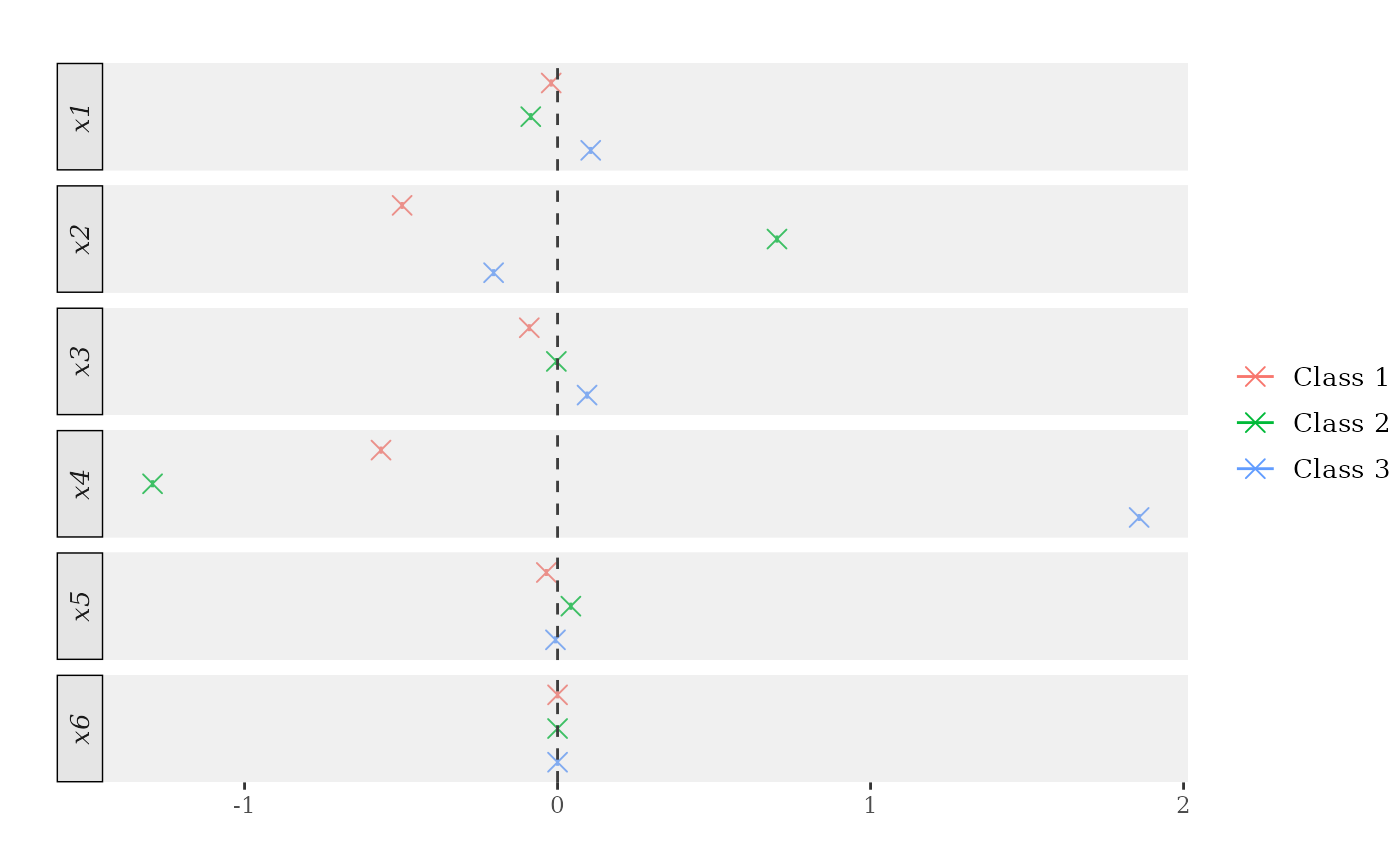
me <- marginal_effects(forests, eval = "atmean")
plot(me)
 ## Add standard errors.
honest_forests <- ocf(Y, X, honesty = TRUE)
honest_me <- marginal_effects(honest_forests, eval = "atmean", inference = TRUE)
plot(honest_me)
## Add standard errors.
honest_forests <- ocf(Y, X, honesty = TRUE)
honest_me <- marginal_effects(honest_forests, eval = "atmean", inference = TRUE)
plot(honest_me)